Modelling dispatch-down across Ireland's grid
We're using Convexity for a variety of modelling projects while we're developing it, which is driving a lot of our design decisions. When we run into a bottleneck as modellers, we go and improve it in the app as developers!
In this post, I'll show off a model of the Irish energy system we've been developing with Infranua, leveraging their comprehensive datasets on generation, transmission, distribution, and other grid assets across Ireland and Northern Ireland:
Our specific goal with Infranua is to build a model to understand dispatch-down of new asset developments, where the grid can't handle intermittent renewable generation that needs to be curtailed due to transmission limits and system stability constraints. This is a growing issue in the system, where about 20% of renewable generation was lost in the last year.
We're also keen to apply the model to new connections of large loads like data centres, or to modelling the revenues available for new storage assets at different locations. We want to present the modelling process more openly than other solutions in the market, exposing all modelling assumptions and numbers clearly to users in Convexity, and writing about the process on here.
This post shows the zonal model split up by grid zone, to give a quick understanding of island-wide dispatch over 2024. Our next post will show a much more granular model suitable for real connection studies at the level of individual asset locations.
Assets in Area A
The model is built from various datasets of assets and network topology provided by Infranua. You can construct the whole network in our visual GUI, but due to the large number of components in this case we used our Python library pyconvexity to build the model programatically.
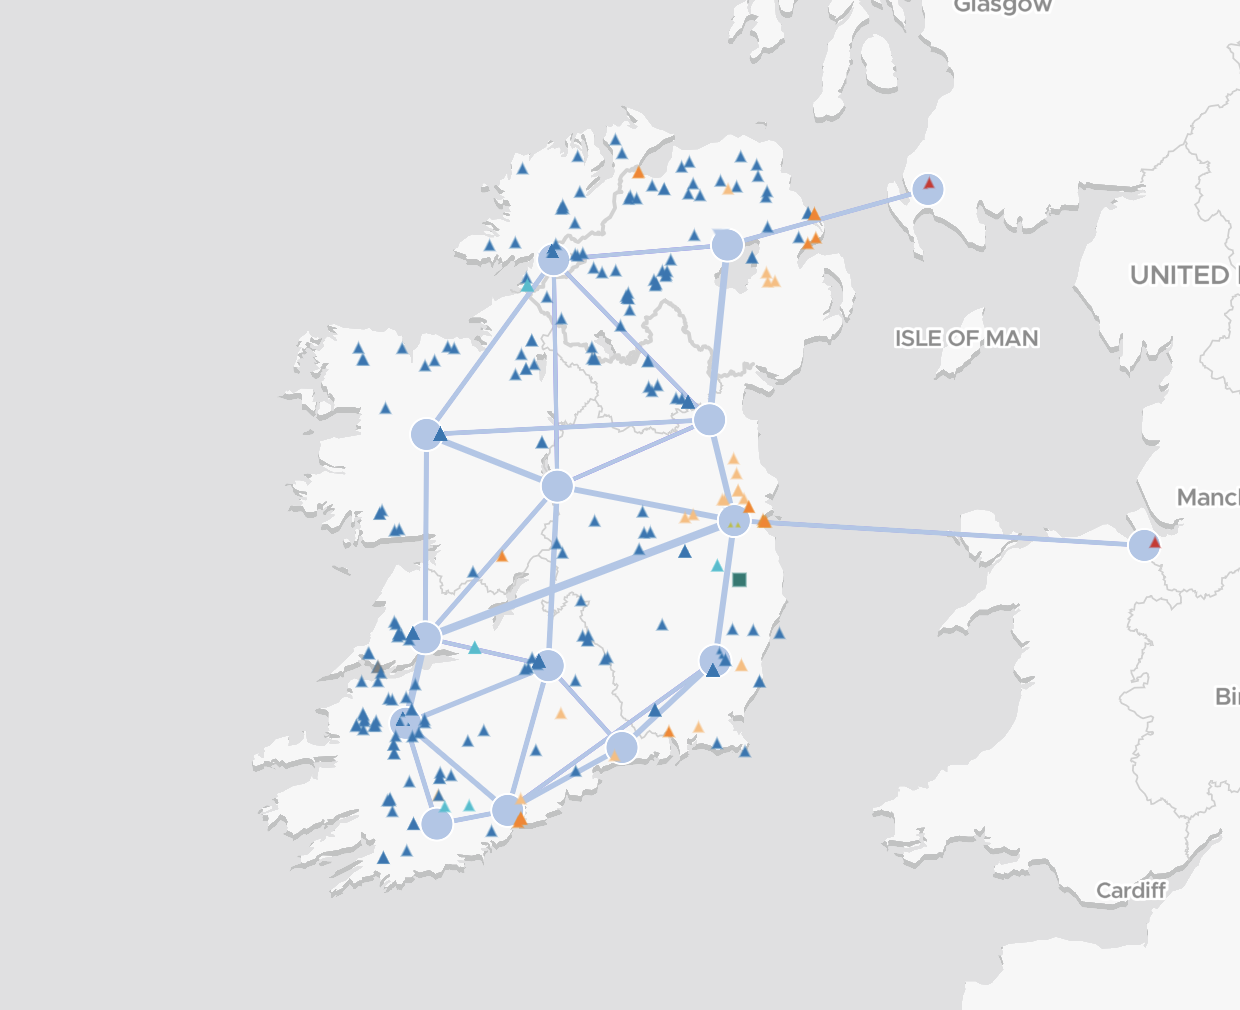
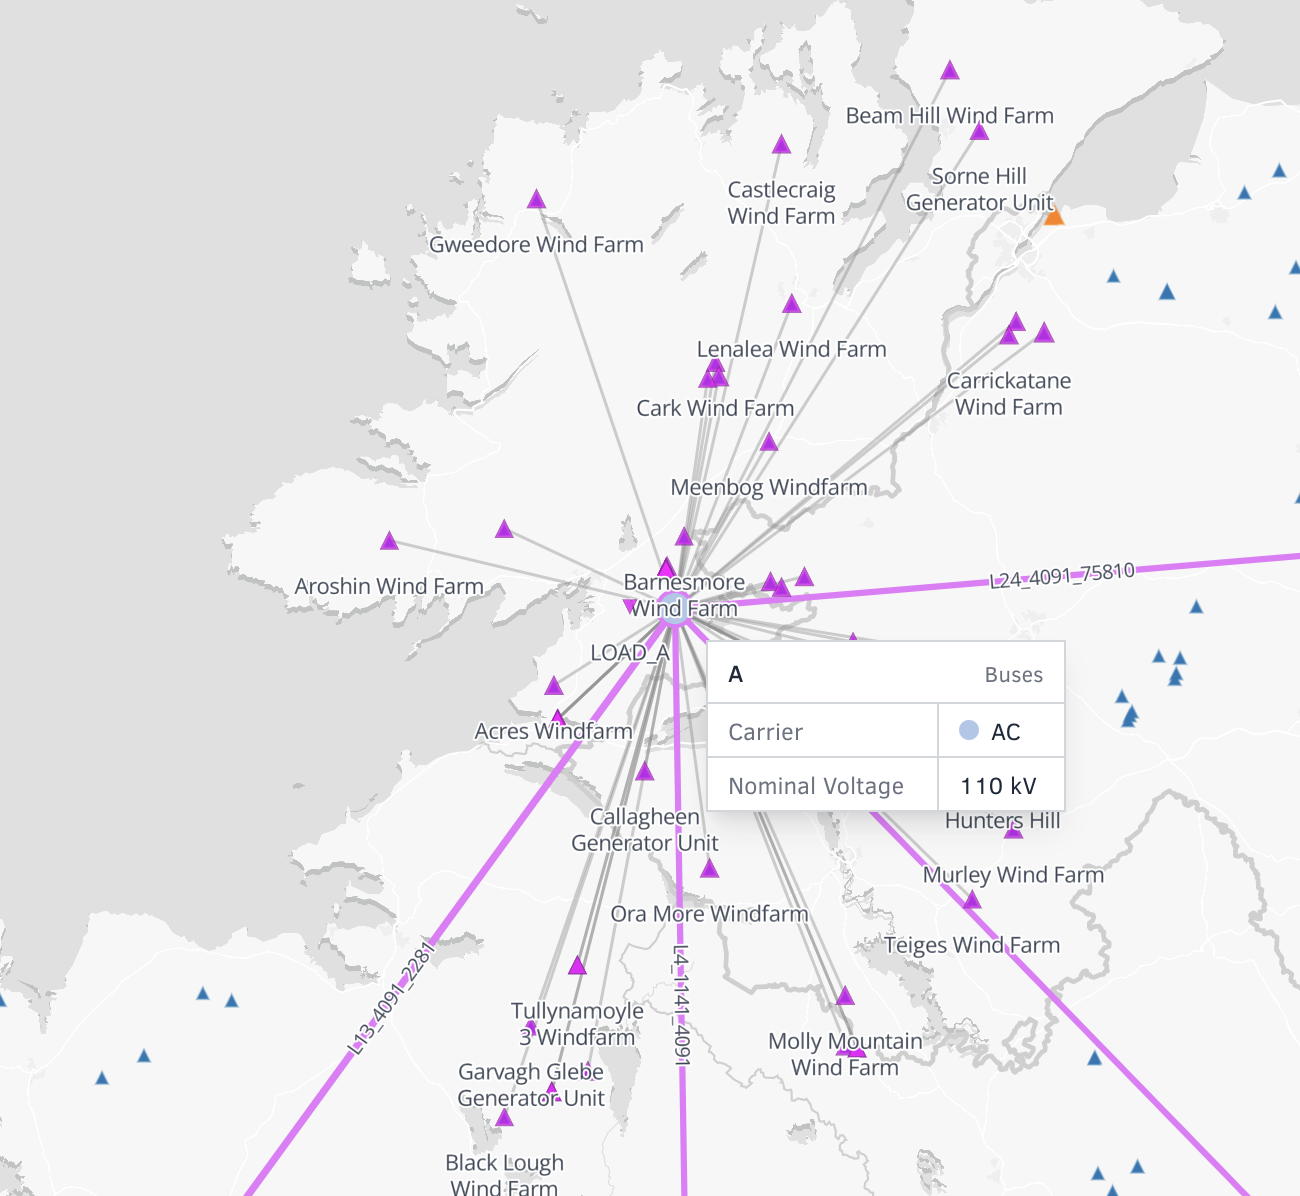
The map below shows all assets connected to grid Area A, which covers the north west of Ireland. In the app you can hover over any bus to see the full list of connected assets.
Assets in Northern Ireland
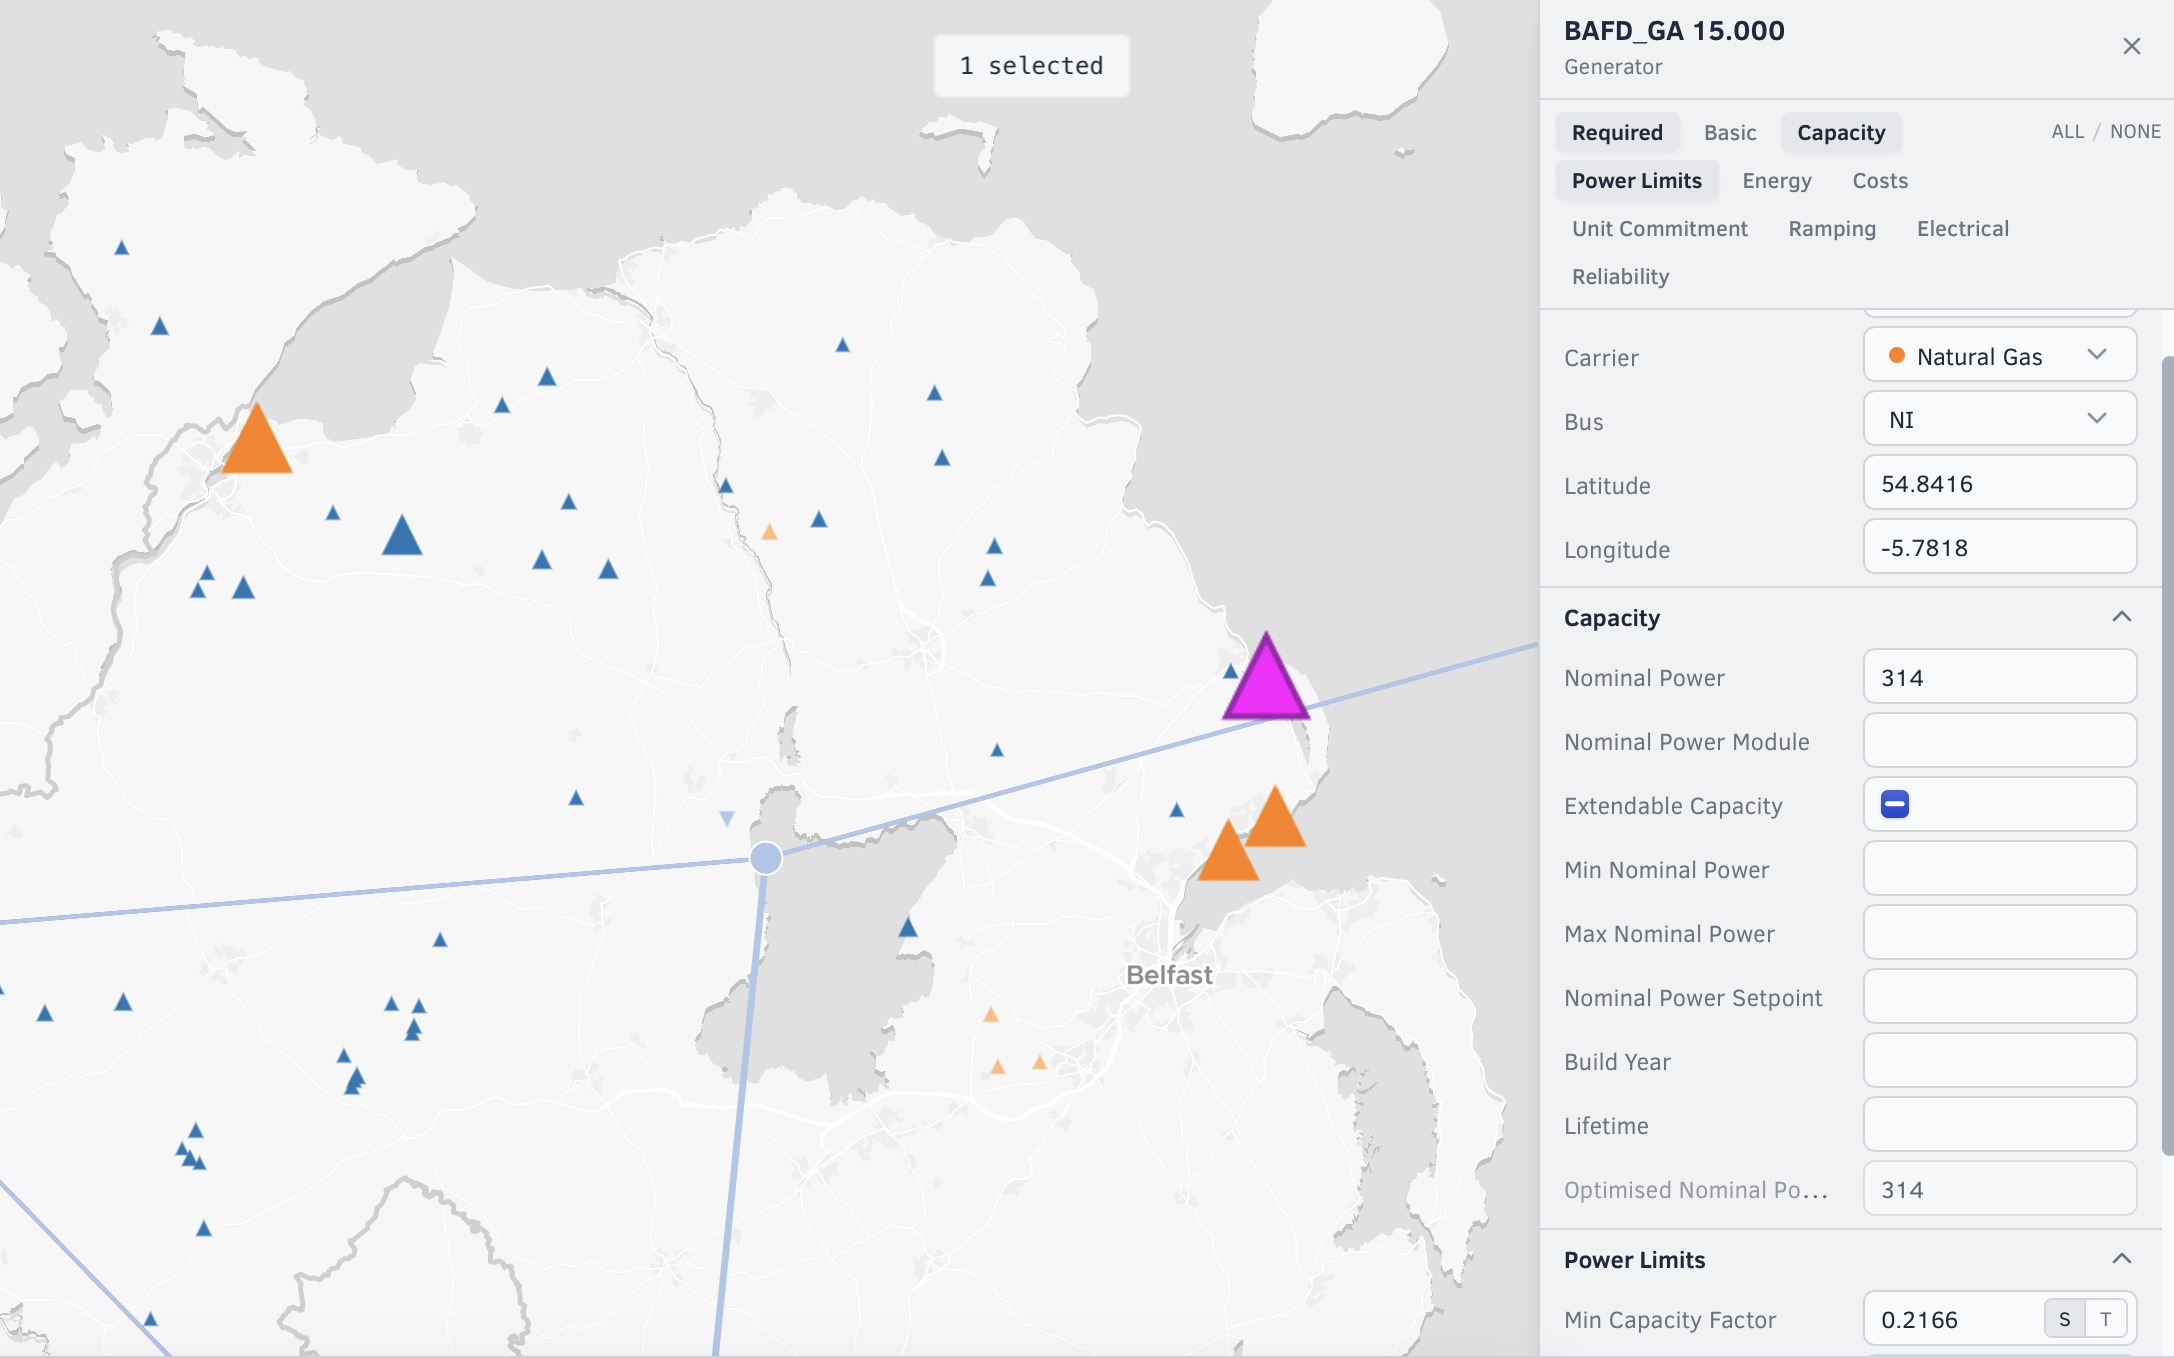
You can customise the map visuals in the app in many ways. In the image below, I've chosen to size the generator assets according to their capacity, showing (orange) gas plants with capacities of around 200 to 400 MW, and (blue) wind farms with capacities of around 10 to 100 MW.
Clicking an asset on the map (like Ballylumford Power Station in this image, highlighted pink) shows its attributes such as capacity and minimum generation level, drawn from Infranua's datasets.
Solving the model
The zonal model solves in around five minutes using our bundled commercial solver. The full granular substation-level model is significantly more demanding, taking approximately 30 minutes and requires substantial RAM — owing to the much larger number of nodes and constraints involved.
Convexity supports both local and cloud solve. If you don't have the compute resources locally, you can submit the model to our cloud infrastructure and retrieve results when complete, with no local setup required beyond the app itself.
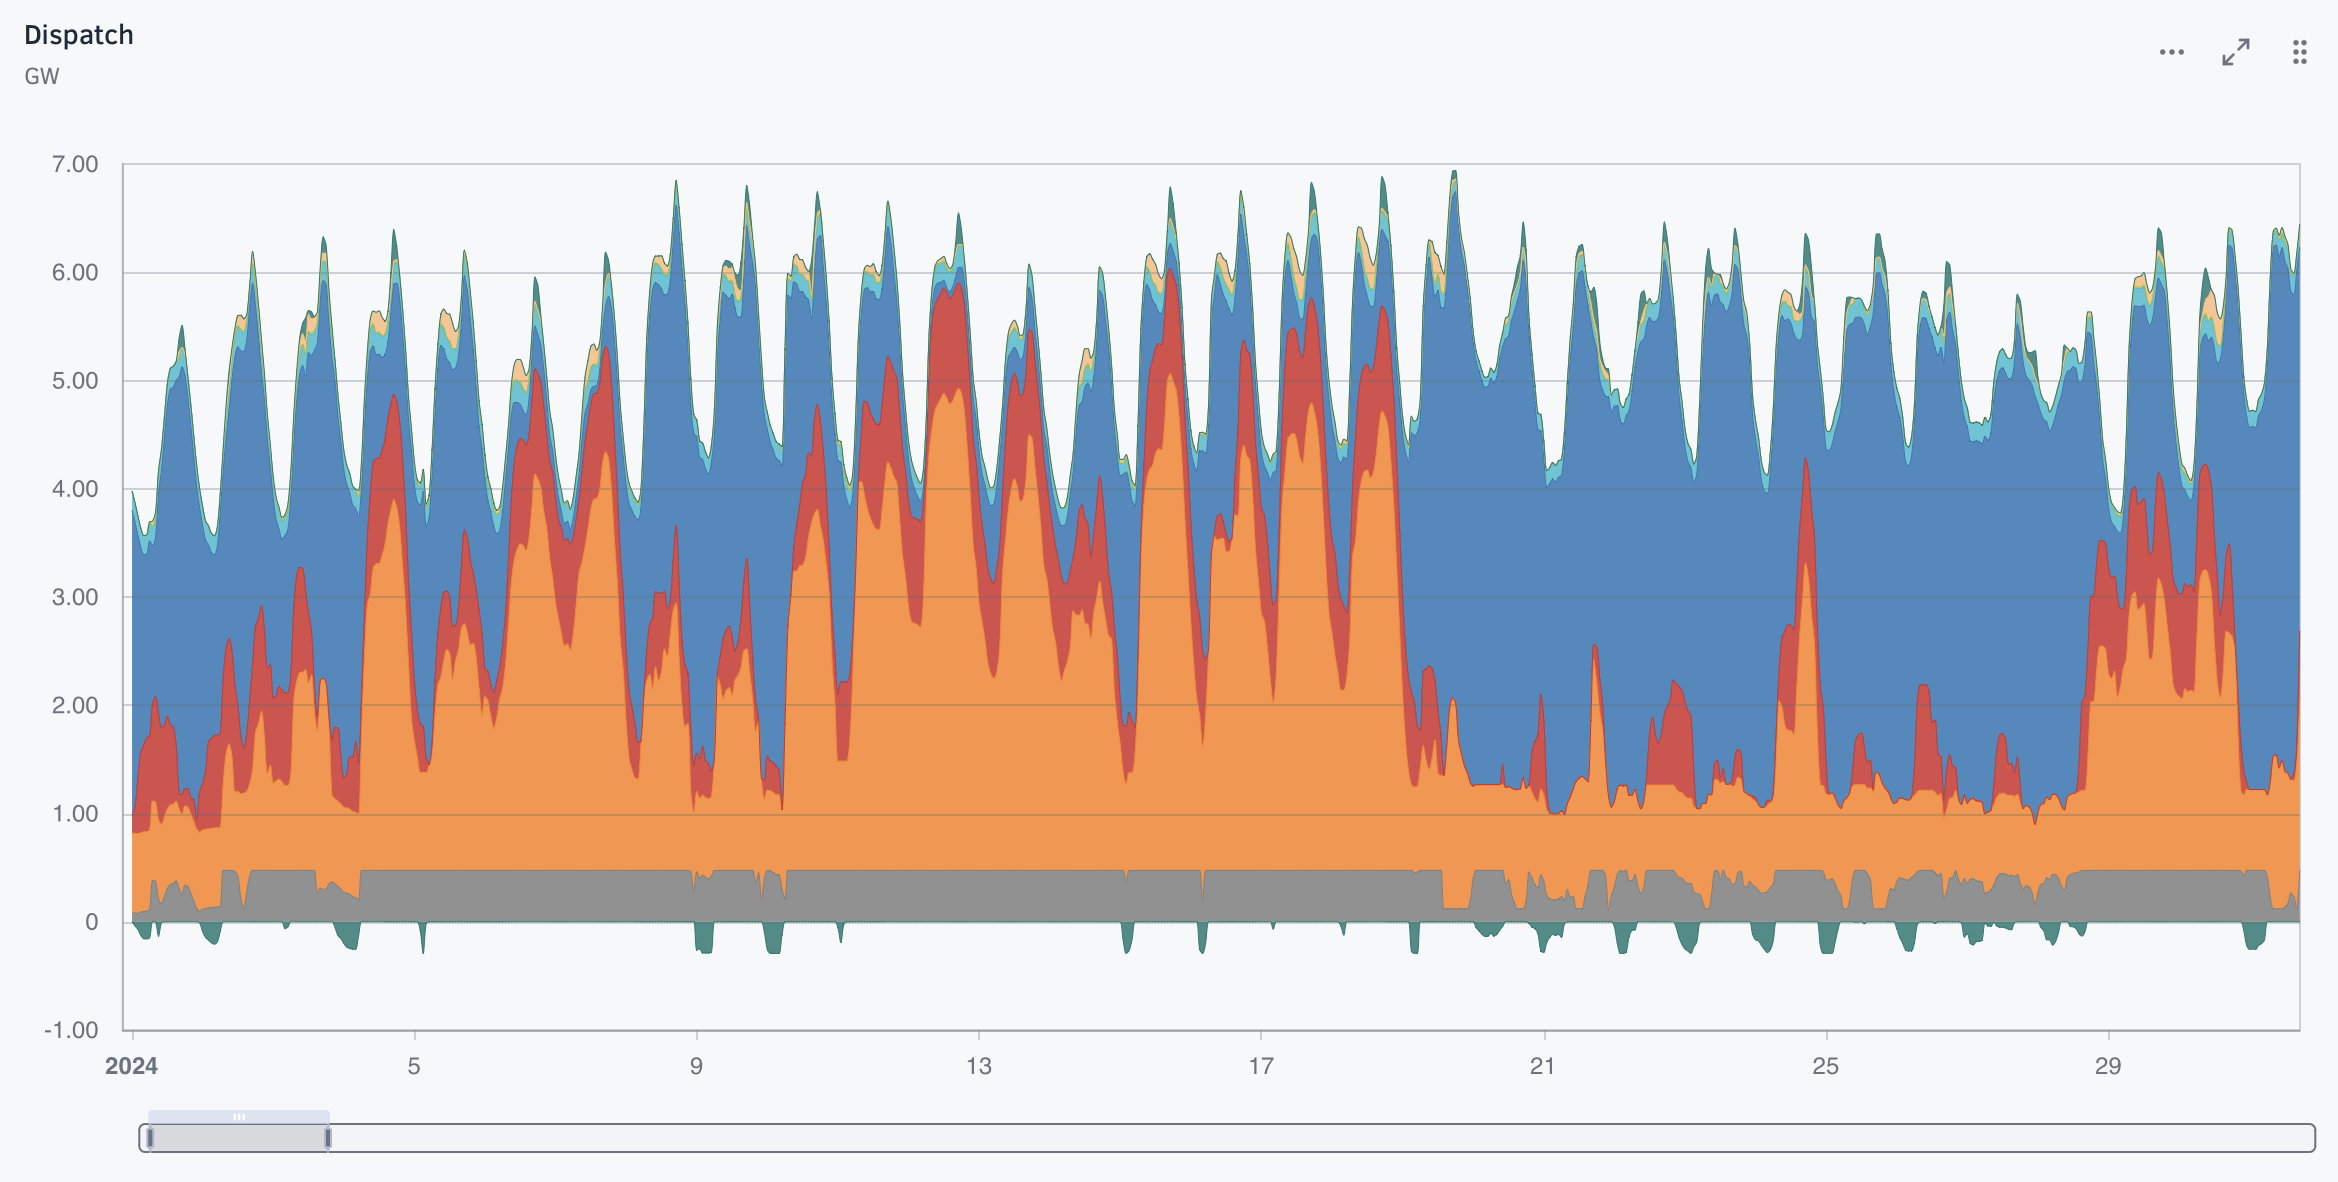
The image below shows the full-year dispatch in the whole system. Gas (orange) and wind (blue) are the two dominant sources across the modelled year. Negative dispatch values represent charging periods, for example pumped-storage hydro (PSH).
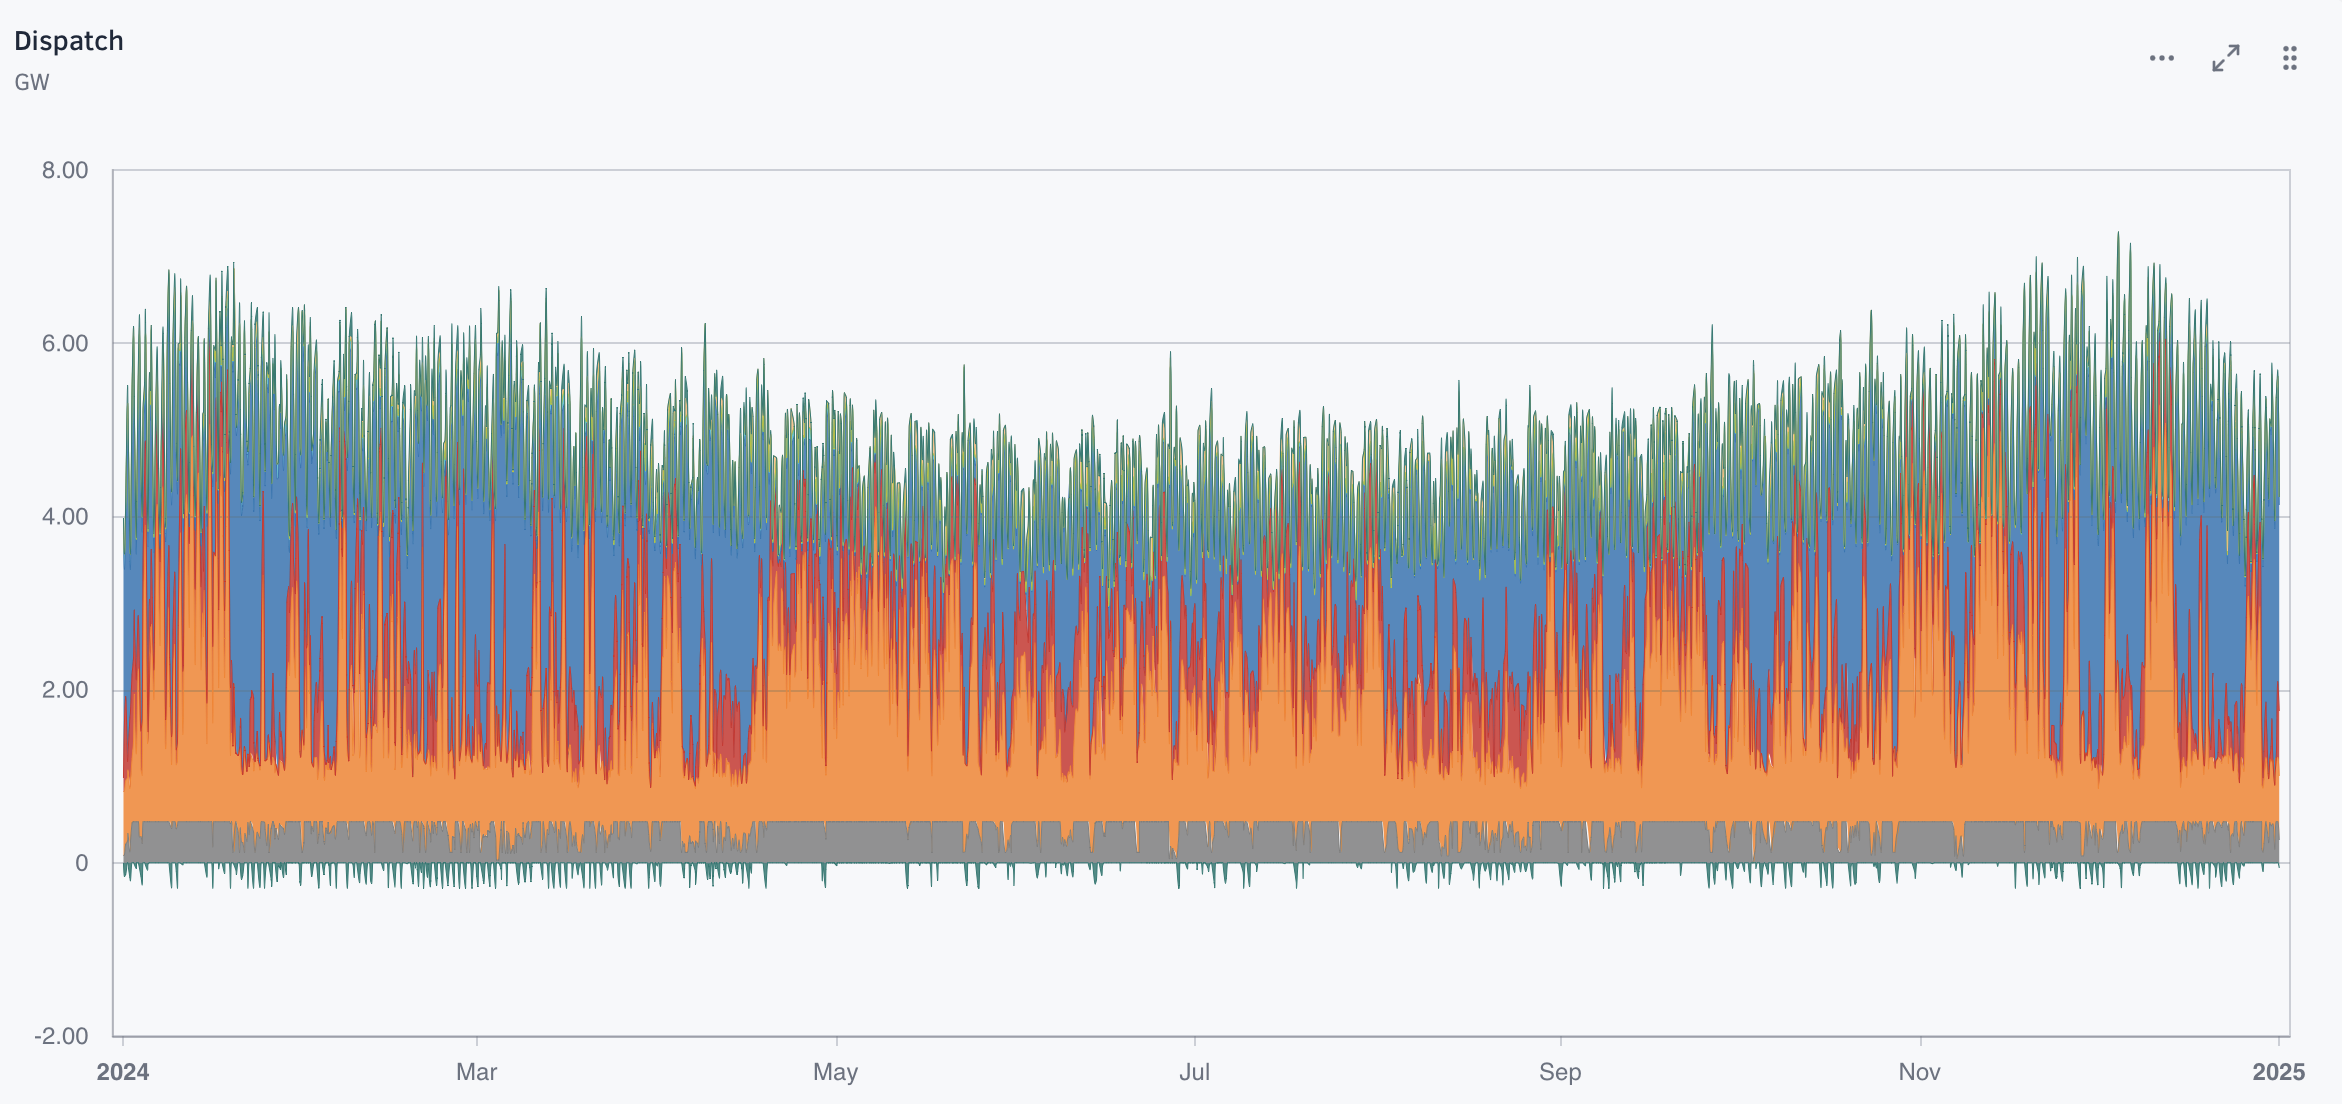
Zooming into January provides a clearer view of the hourly generation mix. Imports from GB (grey) are near-constant, reflecting Ireland's continuous reliance on interconnector flows in winter. A small amount of solar (yellow) appears at midday peaks.
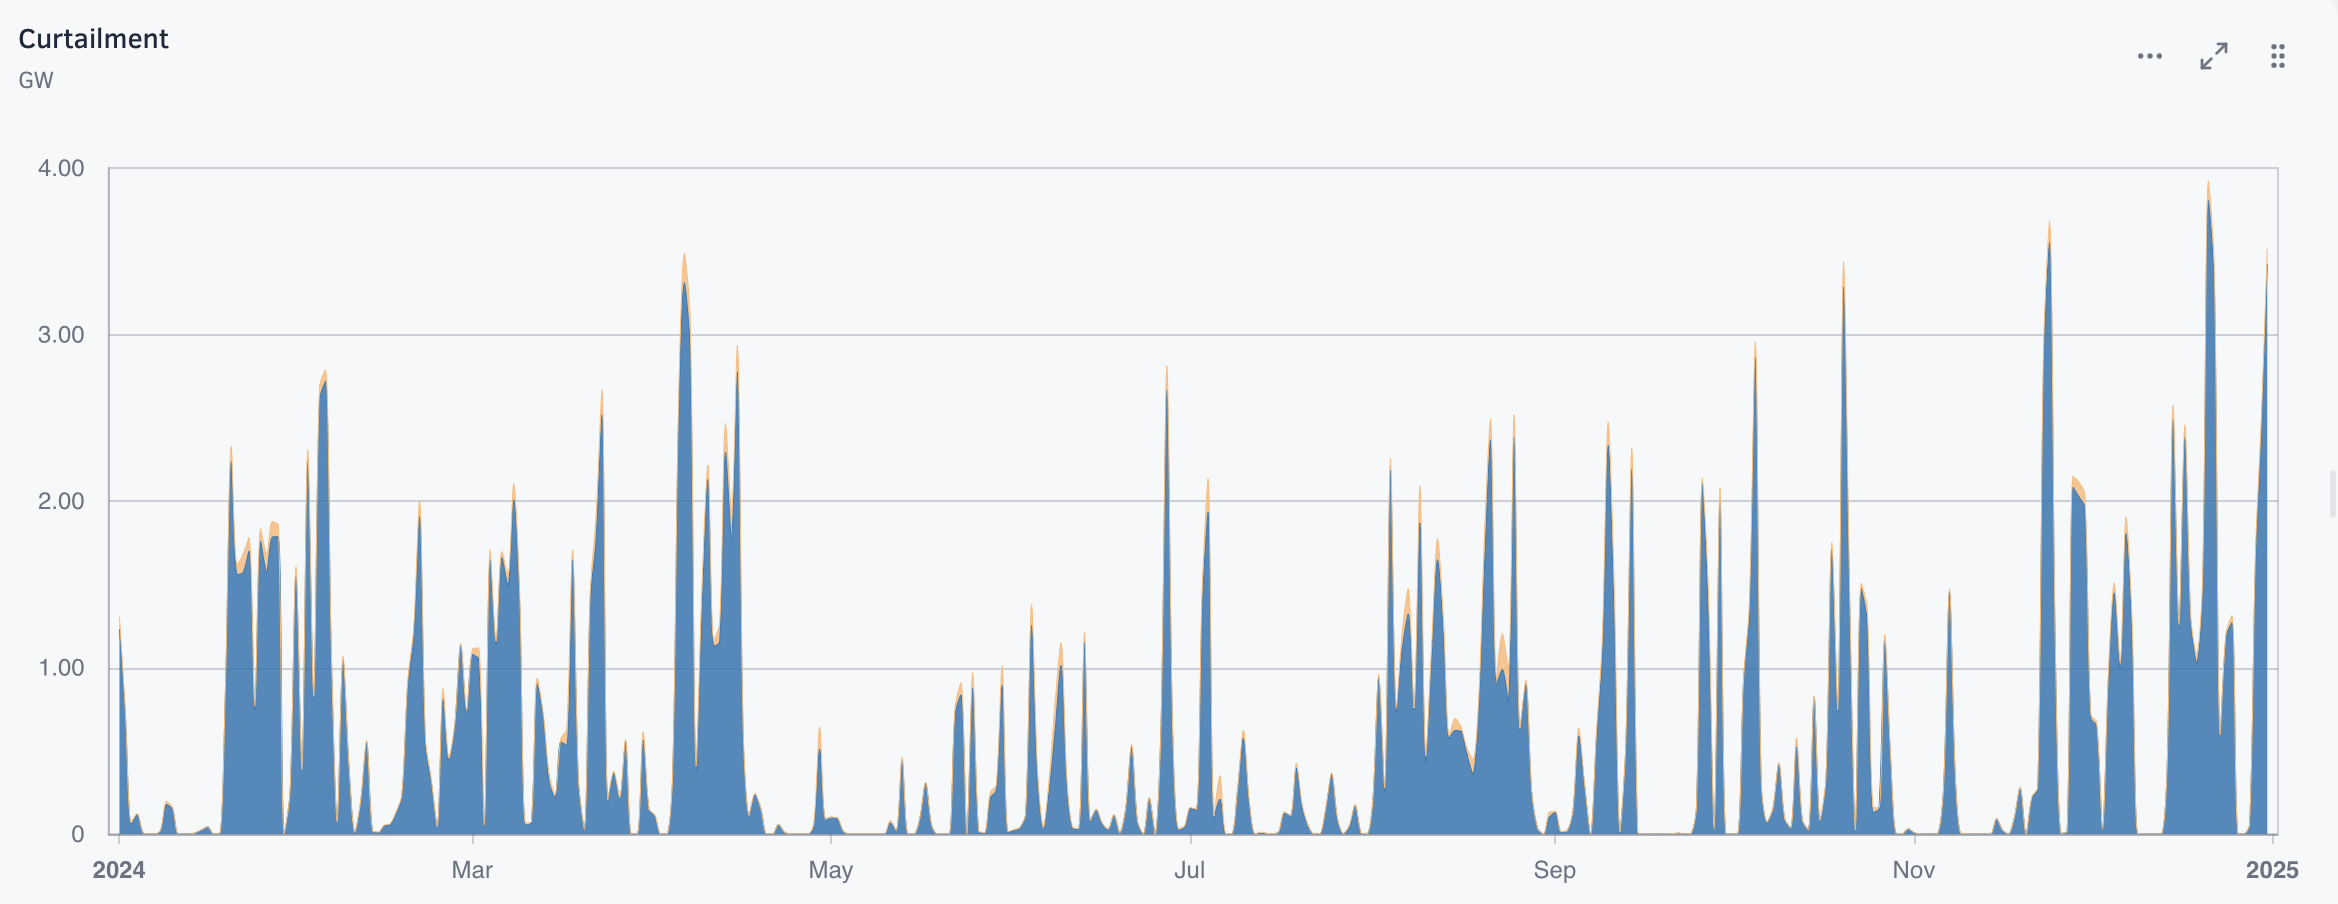
Wind dispatch-down
This chart shows the dispatch-down of all wind assets in the model across the full year, resampled to daily resolution using the visualisation options in the app. This is a rough representation of the real dispatch-down in the system due to the limited resolution of the topology in this zonal model. Our next blog post on the fully granular model will show its more realistic dispatch down levels, and the validation of the model against real data.
What you can do with this model
Dispatch-down is an increasingly important issue in Ireland. This model gives you a way to quantify that risk before committing capital. Here are some of the things you can use it for:
- Assess dispatch-down exposure for new wind or solar developments at specific grid locations
- Compare storage revenues across zones to inform siting and investment decisions
- Model large-load connections like data centres and understand their impact on local grid constraints
- Run your own scenarios by adjusting generation mix, demand profiles, or network capacity to stress-test your assumptions
We'll provide access to the detailed model and its results to customers in partnership with Infranua, so get in touch if you're interested in understanding the Ireland energy system in more detail, especially for new connection studies.
You can contact us at contact@bayesian.energy if you would like to try the app or explore the model yourself.